
Why Today’s Foreclosure Numbers Are Nothing Like 2008

You’ve likely seen headlines about the number of foreclosures climbing in today’s housing market. That may leave you with a few questions, especially if you’re thinking about buying a house. Understanding what they really mean is mission-critical if you want to know the truth about what’s happening today.
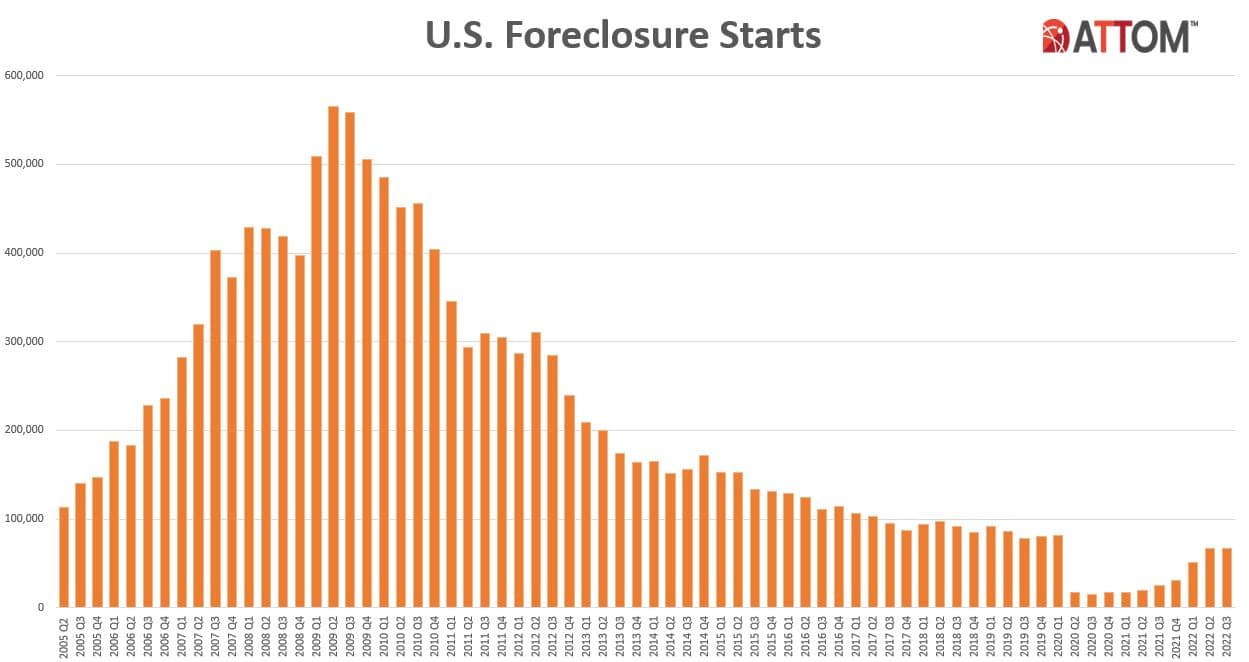
According to a recent report from ATTOM, a property data provider, foreclosure filings are up 6% compared to the previous quarter and 22% since one year ago. As media headlines call attention to this increase, reporting on just the number could actually generate worry and may even make you think twice about buying a home for fear that prices could crash. The reality is, while increasing, the data shows a foreclosure crisis is not where the market is headed.
Let’s look at the latest information with context so we can see how this compares to previous years.
It Isn’t the Dramatic Increase Headlines Would Have You Believe
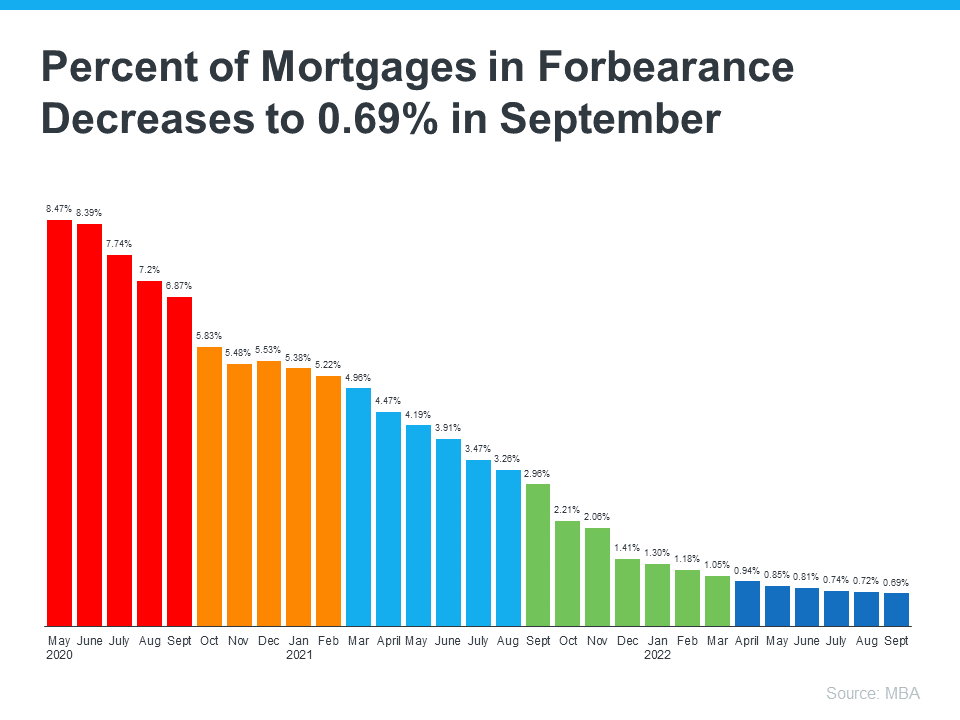
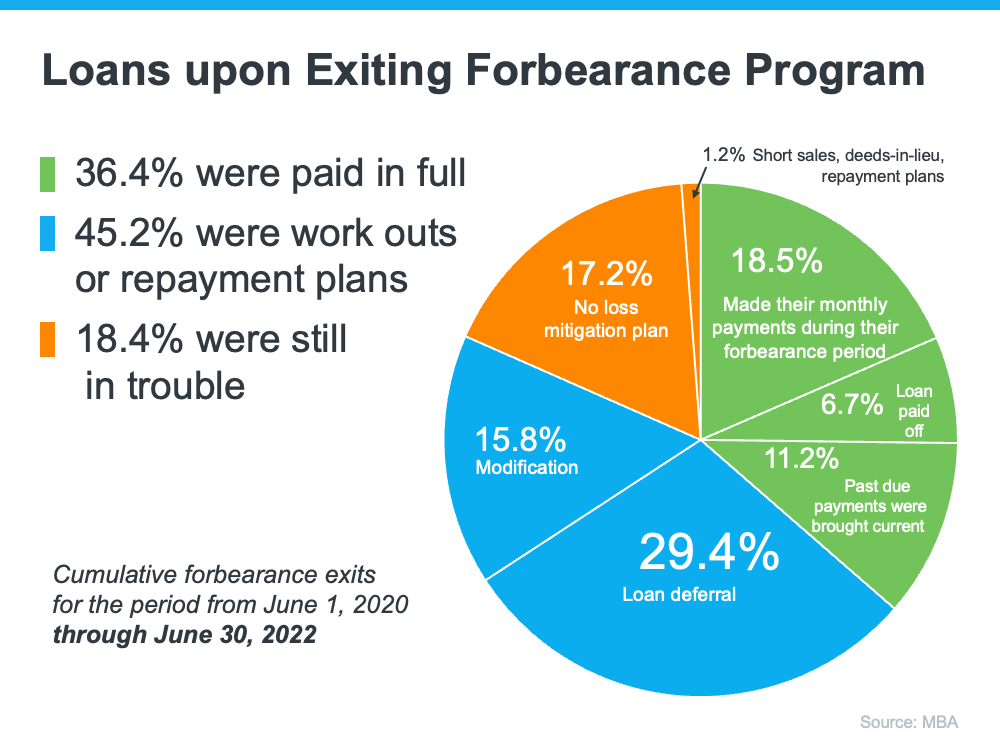
In recent years, the number of foreclosures has been down to record lows. That’s because, in 2020 and 2021, the forbearance program and other relief options for homeowners helped millions of homeowners stay in their homes, allowing them to get back on their feet during a very challenging period. And with home values rising at the same time, many homeowners who may have found themselves facing foreclosure under other circumstances were able to leverage their equity and sell their houses rather than face foreclosure. Moving forward, equity will continue to be a factor that can help keep people from going into foreclosure.
As the government’s moratorium came to an end, there was an expected rise in foreclosures. But just because foreclosures are up doesn’t mean the housing market is in trouble. As Clare Trapasso, Executive News Editor at Realtor.com, says:
“There’s no reason to panic, at least not yet. Foreclosure filings began ticking up . . . after the federal foreclosure moratorium ended. The moratorium was enacted in the early days of COVID-19, when millions of Americans lost their jobs, to prevent a tsunami of homeowners losing their properties. So some of these proceedings would have taken place during the pandemic but got delayed due to the moratorium. This is a bit of a catch-up.”
Basically, there’s not a sudden flood of foreclosures coming. Instead, some of the increase is due to the delayed activity explained above while more is from economic conditions. As Rob Barber, CEO of ATTOM, explains:
“This unfortunate trend can be attributed to a variety of factors, such as rising unemployment rates, foreclosure filings making their way through the pipeline after two years of government intervention, and other ongoing economic challenges. However, with many homeowners still having significant home equity, that may help in keeping increased levels of foreclosure activity at bay.”
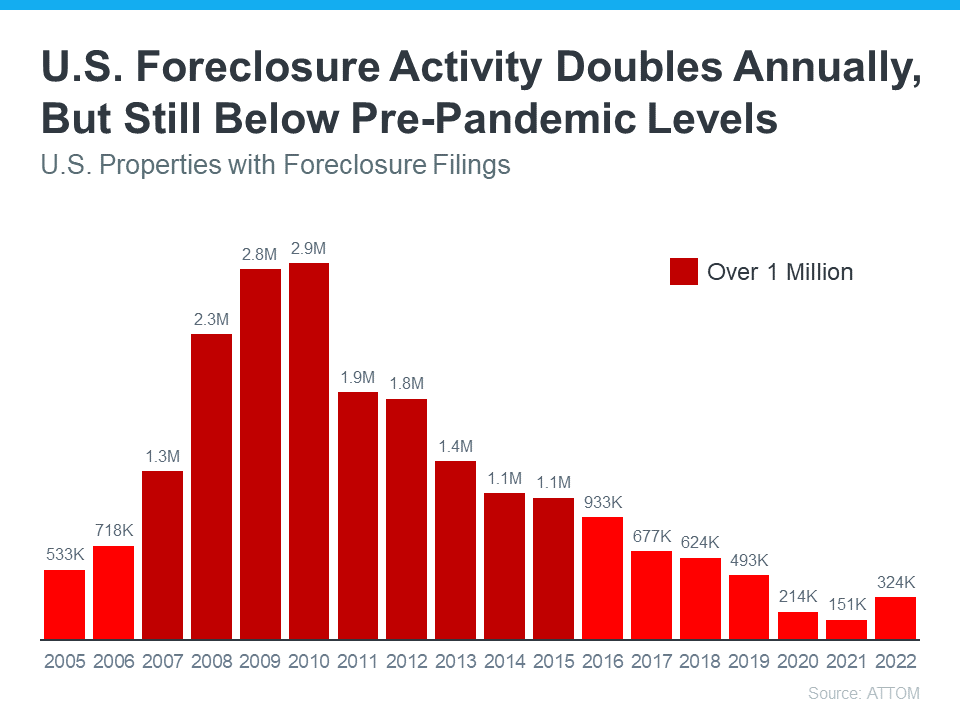
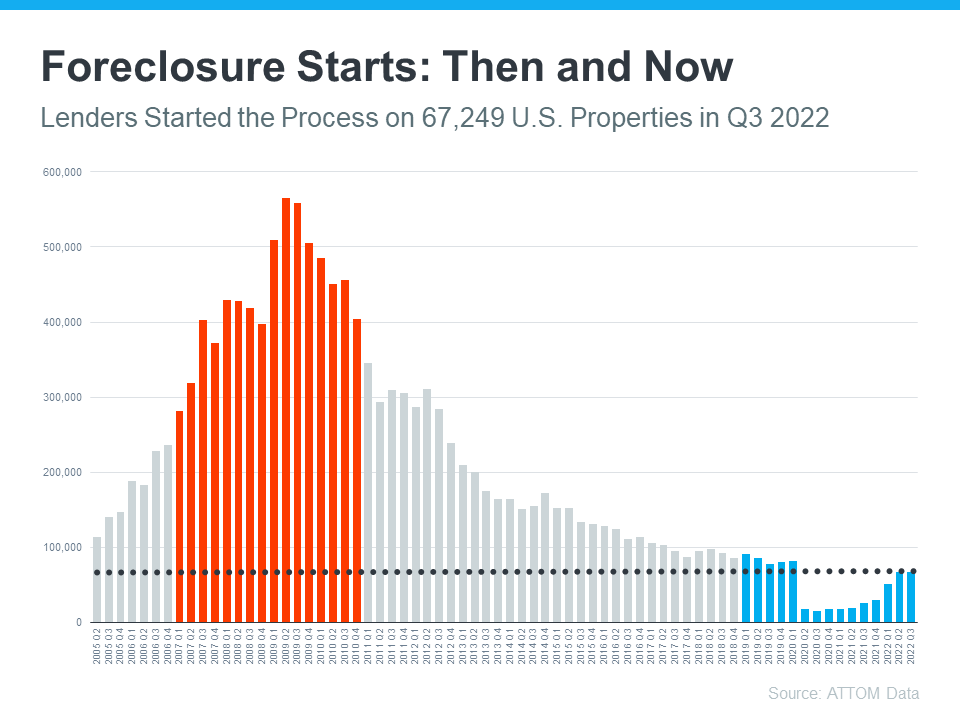
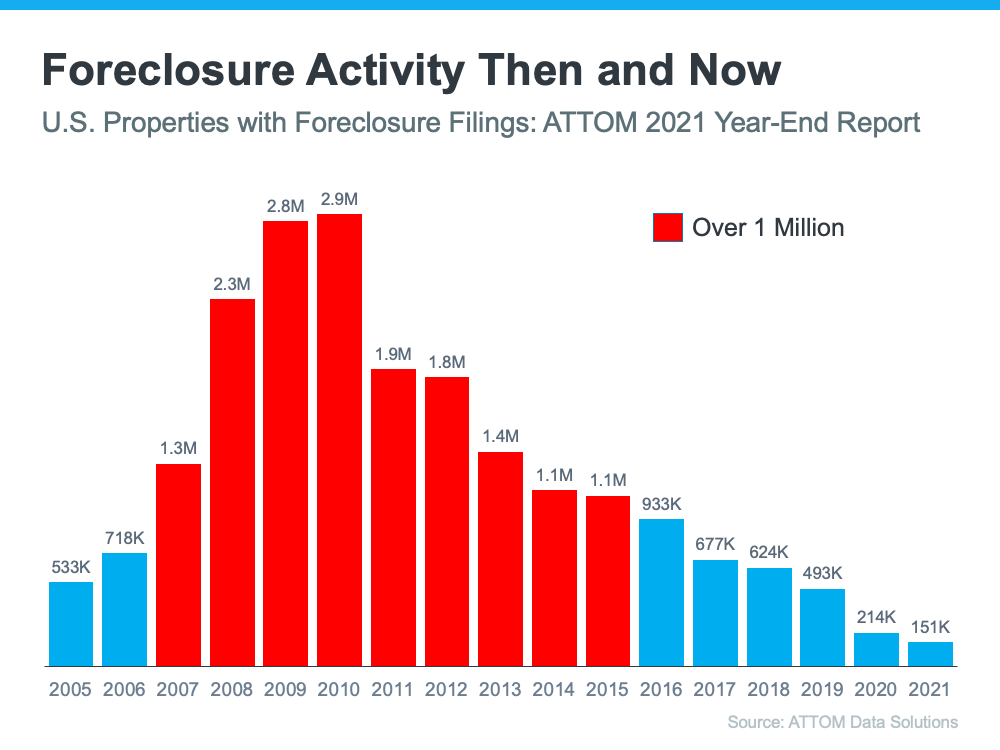
To further paint the picture of just how different the situation is now compared to the housing crash, take a look at the graph below. It shows foreclosure activity has been lower since the crash by looking at properties with a foreclosure filing going all the way back to 2005.
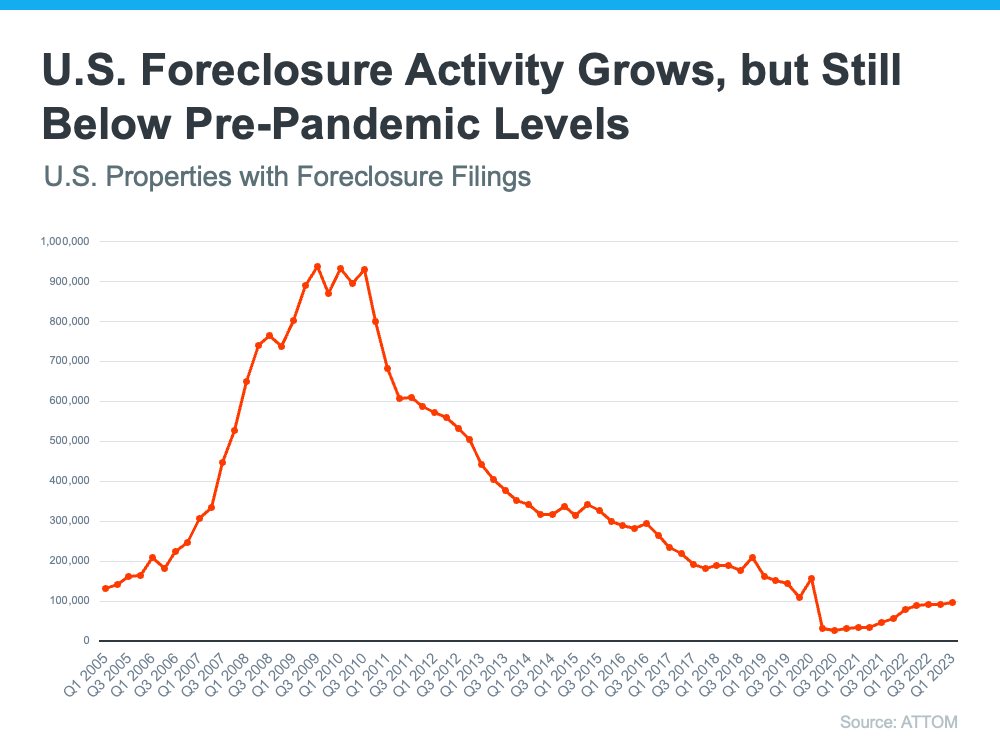
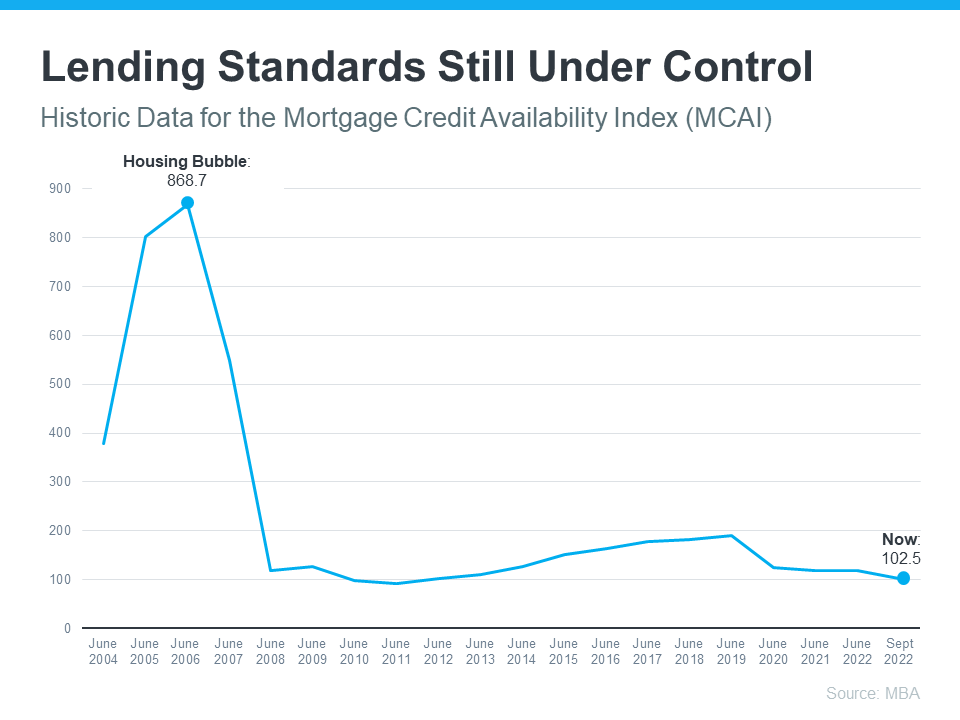
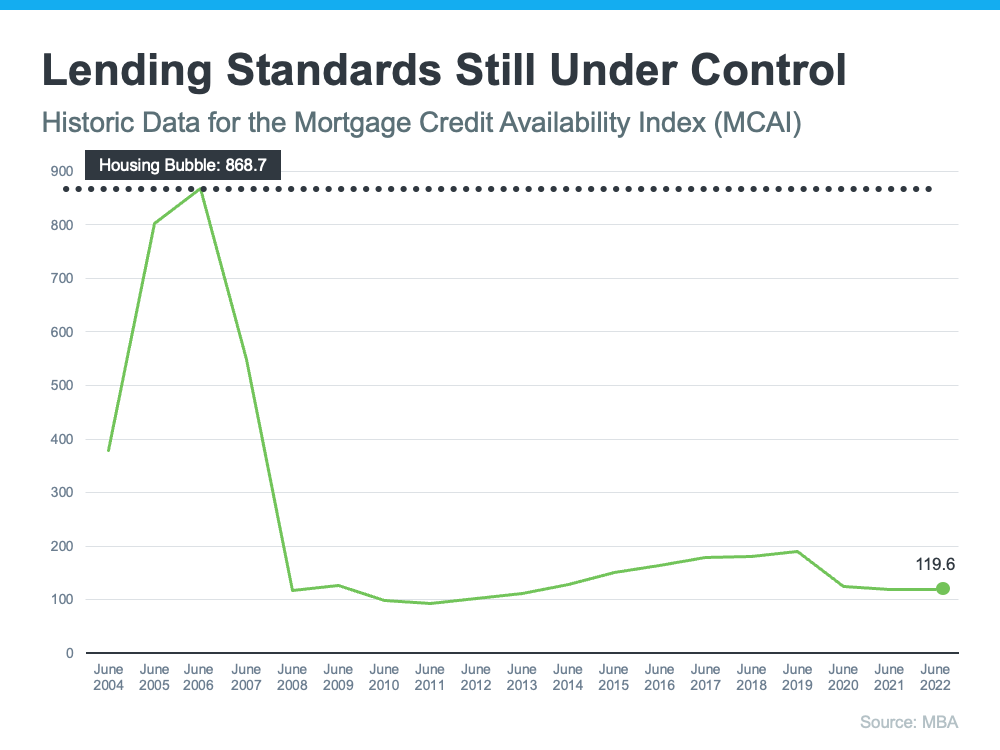
While foreclosures are climbing, it’s clear foreclosure activity now is nothing like it was during the housing crisis. In addition to all of the factors mentioned above, that’s also largely because buyers today are more qualified and less likely to default on their loans.
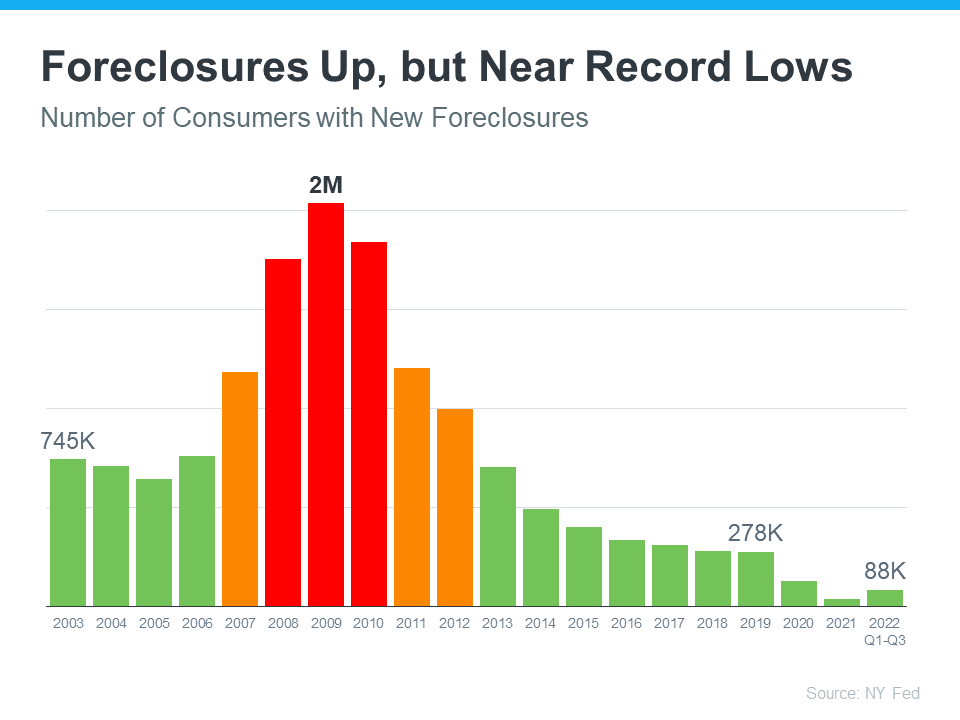
Today, foreclosures are far below the record-high number that was reported when the housing market crashed.
SBottom Line
Right now, putting the data into context is more important than ever. While the housing market is experiencing an expected rise in foreclosures, it’s nowhere near the crisis levels seen when the housing bubble burst, and that won’t lead to a crash in home prices.
![Here’s Why the Housing Market Isn’t Going To Crash [INFOGRAPHIC] Simplifying The Market](https://allavenuerealty.com/wp-content/uploads/2023/03/20230317_Heres-Why-The-Housing-Market-Isnt-Going-To-Crash-KCM-Share.png)
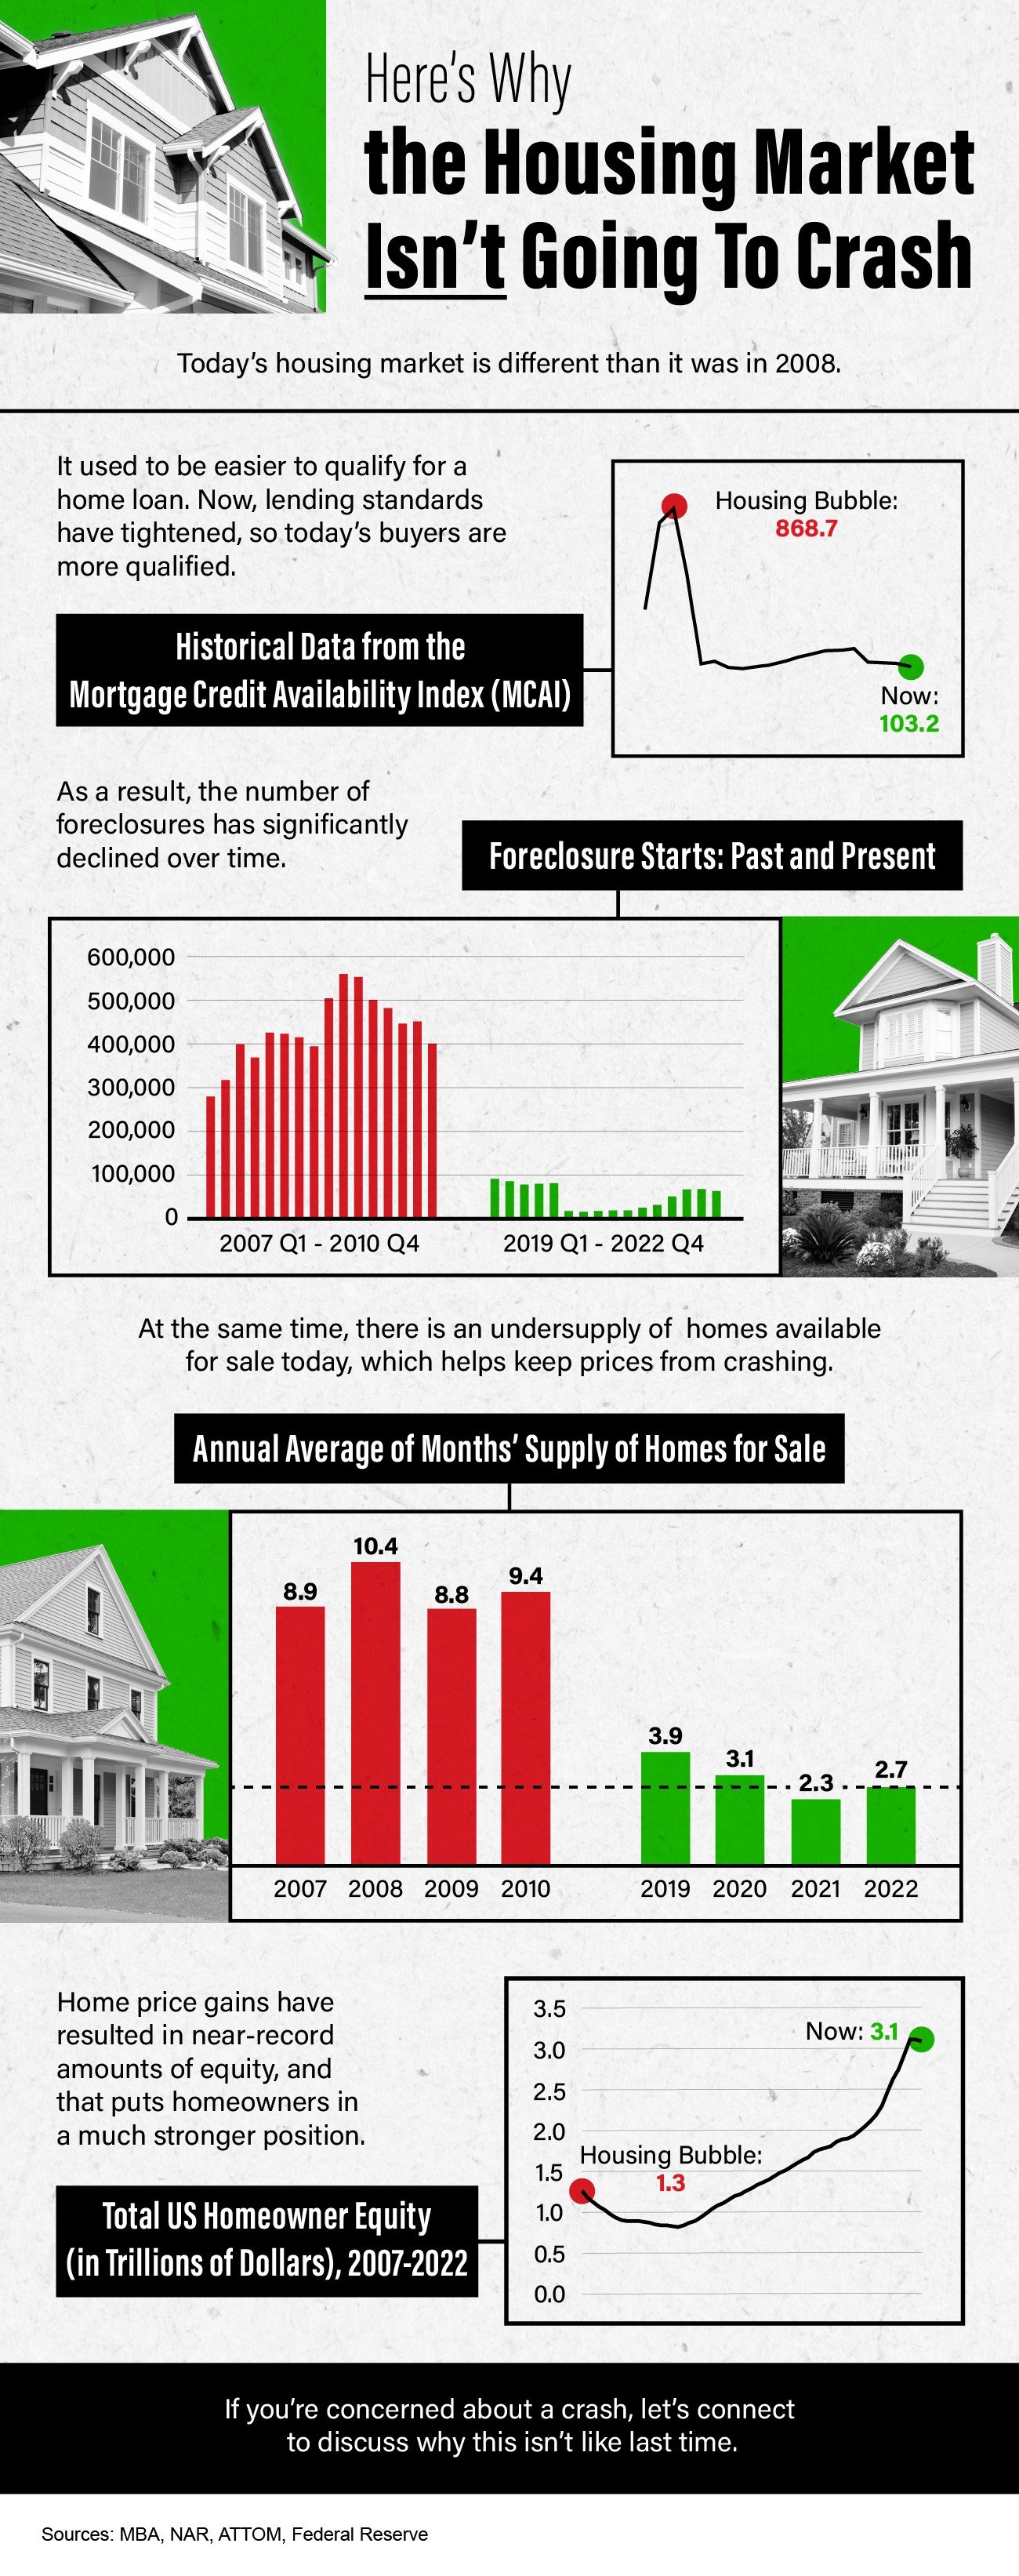


 There’s no doubt today’s


Follow Us!